Case Scenario
A new order has just been started on a work centre that already had production running during the current shift. When comparing the OEE gauges (Availability, Performance, Quality and OEE %) on the Plant Watch screen with the Order Detail screen for the same work centre, the values do not match.
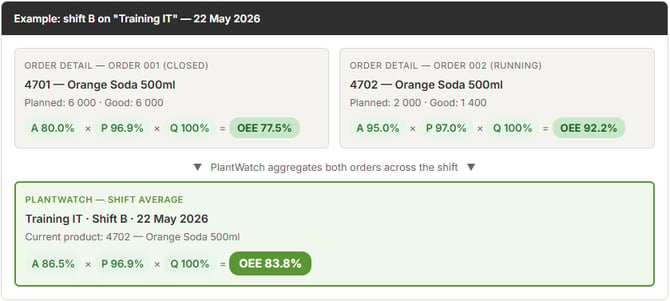
Order 001 finished with 77.5 % OEE, while order 002 is currently running at 92.2 % OEE. Plant Watch averages both orders together for the shift, resulting in 83.8 % OEE — a value that does not match either individual order.
Behaviour Explanation
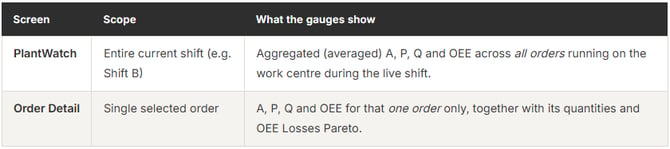
This is expected behaviour. The two screens are designed to show OEE at different scopes:
In the example above, two orders ran on the "Training IT" work centre during shift B. Order 001 finished with an OEE of 77.5 %, while order 002 is currently running at 92.2 % OEE. Plant Watch averaged both orders together, producing a shift-level OEE of 83.8 % — a number that does not match either individual Order Detail view.
Conclusion
The difference in OEE values between Plant Watch and Order Detail is by design:
- Plant Watch = shift-level aggregate across all orders on the work centre.
- Order Detail = single-order view.
Both numbers are correct — they answer different questions.
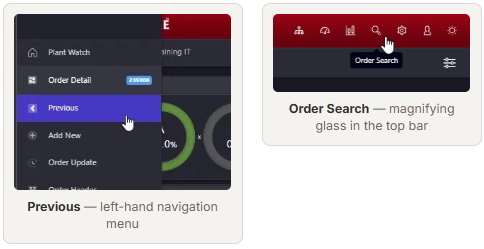
To review the values for each individual order, click on the interactive work centre object on Plant Watch to navigate to Order Detail, then use Previous in the left-hand navigation menu to step through earlier orders in the shift. Alternatively, use Order Search (magnifying glass icon in the top navigation bar) to list all orders for a given date range and click into any order directly.